Benchmarking Retro Macs : Norton System Info
There are a number of classic Mac OS benchmarking tools available. Different ones have various benefits and personal preference is a major factor in choice. I’ve always used Norton’s System Info, which is provided as part of the Norton Utilities suite for Macintosh. I believe that it was first include with version 3 of Norton Utilities, but I need to verify that. As a kid, this was simply the only benchmark we owned, I like that it makes it clear what it is doing to benchmark (tests are named for the low level function that is being tested, often Macintosh Toolbox routines), and it uses a photo of two cats for the graphics tests that is clearly just a photo of a programmer’s pets. Its not even a very good photo, but this little human touch cheers me up every time I see it, and that’s worth a lot.

System Info requires System 7 to run, and so an alternative benchmarking tool such as Snooper would be needed if you are running System 6.
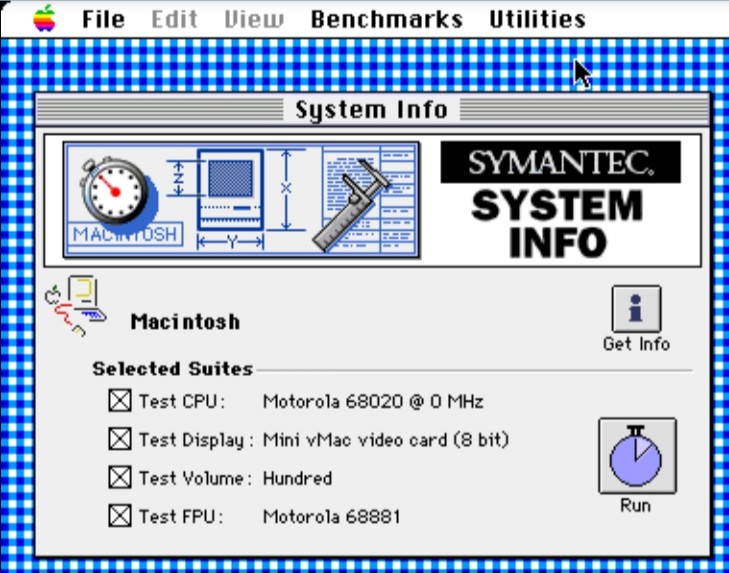
Over time, there were few obvious changes within the System Info application. Included benchmarks and System used as the baseline (100 in tests) varied through time. I… think it started as the SE, but haven’t seen this version lately… but more common versions were the Quadra 700, and later the Power Macintosh 6100/60. The following shows System Info’s default window on launch. Later versions show a splash screen while launching, earlier versions did not.
Features include
- 68k and PPC support.
- An extensive collection of included benchmark files for both stock and some accelerated Macintosh computers.
- Top level CPU, 2D (Quickdraw) graphics, disk and FPU scores.
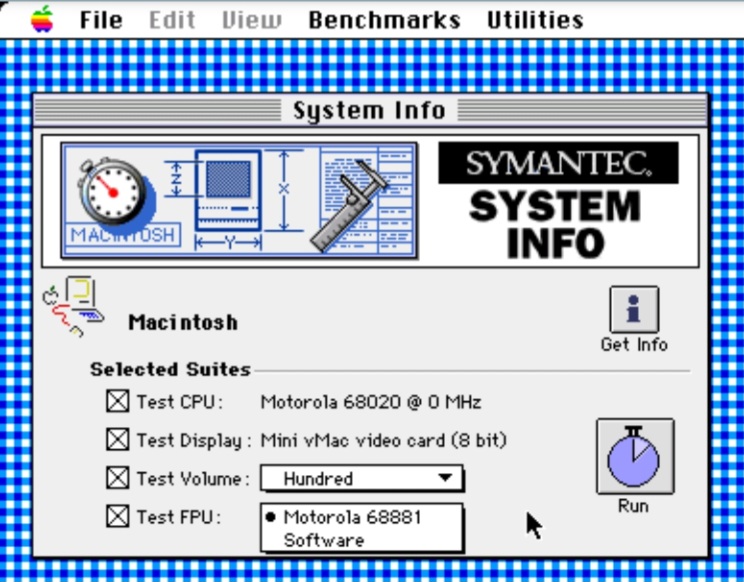
- Ability to select PPC or emulated 68020 performance on a PowerPC, and physical or software FPU where available.
- Ability to select which video card and which disk.
- Advanced mode which shows more detail during tests, and gives more detail in results. Graphical and tabulated results available, with the ability to show tabulated results in relative or absolute terms.
- Results can be easily shared as saved individual files for each test run.
- A detailed description of the computer and settings automatically saved with the results file.
- Warns about some system settings which may impact performance, such as AppleTalk, Virtual Memory, video bit depth and Disk Cache.
- A tiny application.
Disadvantages
- New users don’t notice the need to enable advanced features and assume the tool is more simplistic than it is.
- As is often the case, the performance benefits of a relatively small cache are possibly exaggerated as the tests seem to be repetitive and fit within the cache (difficult because caches give significant real world advantages, but not in all instances).
- It doesn’t seem to be possible to export tabulated data, for example, as CSV.
- Tests are very much function based and not representative of real world activities.
- Graphics tests are only QuickDraw 2D, and don’t include any QuickTime, RAVE, QuickDraw 3D, Glide or OpenGL tests.
- Not scriptable?
Tips and Tricks
- Even if the version of Norton you’re using is too new for the computer you are using, if you go into the “Norton Tools” folder and run “System Info” from there, it will launch in most circumstances, as long as you have System 7 or newer.
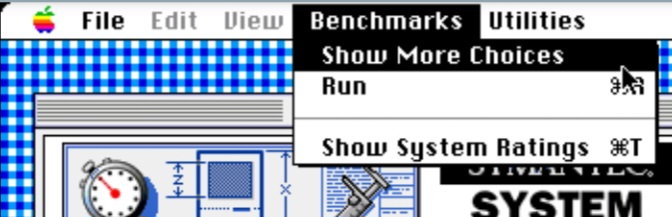
- To enable advanced options within the software, select “Show More Choices” from the “Benchmarks” menu. This provides a number of additional drop down menus for fine tuning and seeing results in a greater level of detail throughout the application, as well as some additional menu items.
- Note that generally, the higher the video bit depth you run, the slower graphics performance will be, except where acceleration is only provided at higher bit depths. It was fairly common for video cards to not provide acceleration at bit depths below 8bit, and a small number of cards only provided 24bit acceleration.
- Screen resolution doesn’t appear to have a significant impact on video scores, although running at 640×480 is probably best to ensure consistency with built in benchmarks.
- When in the “System Ratings” window, selecting a system from the list and clicking the “Get Info” button (see image “All Results Windows” below) will show a description of the system the benchmark was performed on. Details are given of both hardware, software and some system settings.
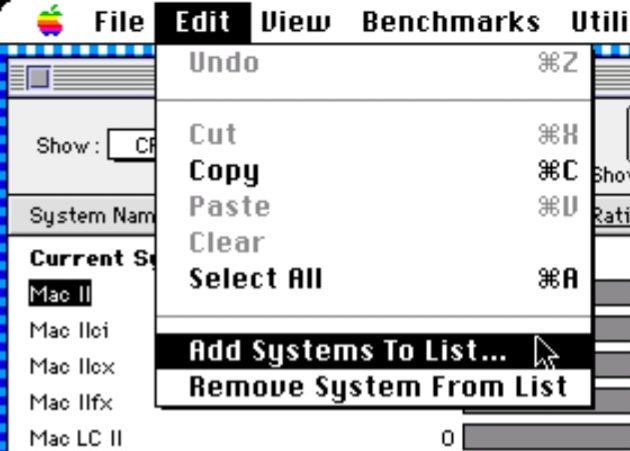
- Additional results can be added to the various results windows using the “Add Systems To List” menu item from the “Edit” menu.
Running a Test
Use the “Selected Suites” checkboxes to enable and disable each of the CPU, video, disk and FPU test suites and if in advanced mode, select between the real and emulated CPU, video card, disk (in reality, the list given is mounted partitions) and FPU or software. Not all of these options will be available at all times, depending on the computer under test.
Link to video showing System Info benchmarks (at 3:22)
Once the options are as desired, click the “Run” button. Note that at this point Norton will inform you of any System settings it has detected which will impact the scores and which it thinks you should change. Unless you’re doing specific testing, such as comparing 24bit mode between cards, it is generally advisable to follow this guidance. A restart may be required for some changes (for example, disk cache, and AppleTalk on some System versions).
After this the tests will start. Depending on the performance of your computer, they may take quite a few minutes to run, especially the disk tests. In the advanced mode, you will be given greater detail of what test is currently being undertaken and what each test scores. This can help with the boredom of waiting for the tests to complete.
Once the benchmarks have completed, System Info automatically opens the System Ratings window, and lists the tests just undertaken as “Current System”. It is probably a good idea to save the results at this point if you plan to keep them for comparison.
Reviewing Results
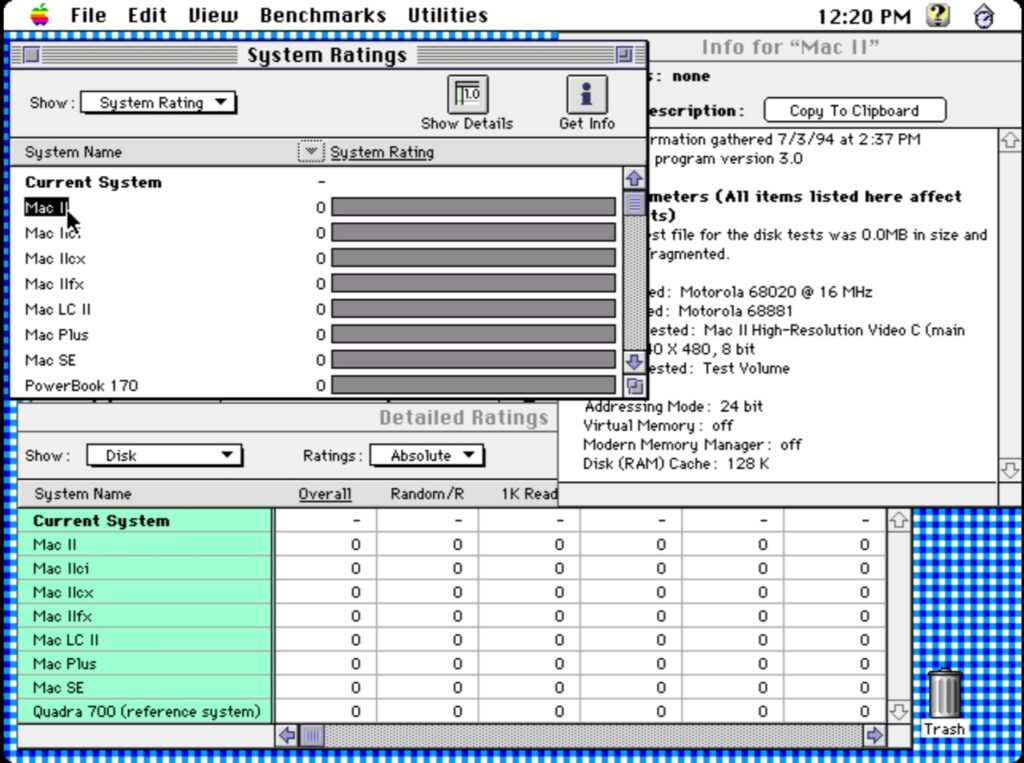
Note – the screenshot above incorrectly shows zeros for all results. This is an oddity of running the software within an emulator. Something I did for convenience when getting screenshots. On real hardware you will see actual scores for your and other computers.
Viewing Overall Rating / Test Category / Individual Tests
At the top left of the “System Ratings” window, there is a pop-up menu labelled “Show”. This allows you to select each of the four test categories, CPU, Video, Disk or FPU, as well as the default overall summary “System Rating”. The numbers to the right of each system name represent a score, relative to the baseline system (e.g. scaled where a Quadra 700 equals 100, or a 6100/60 equals 100 etc. dependant on the version of System Info you are using. The baseline system is identified in the list by the text “(reference system)” following its name). The bars to the right of these numbers (ordinarily) vary in length and graphically represent the score for each system.
If all tests were not run, the Current System will show as a dash “-” for the tests which were not completed, as well as for the overall “System Rating”.
If advanced mode (i.e. with “show more choices” enabled), an additional drop down menu is available by clicking the downwards pointing triangle to the left of the “System Rating” column heading. This menu allows you to select individual tests for the category currently selected, for example, if you have selected “Disk”, then you will be able to choose to display specifically the random write, or perhaps 1K read test.
It is worth studying the results at this level, especially with respects to video accelerator performance, because it can be interesting to see how different cards perform in different areas. A card that scores well overall might be weak when it comes to rendering text compared to another card that scores lower overall. In this case, if your primary use case is… rendering text – the supposedly “slower” card might be the best card for you as it performs better in your very text rendering application.
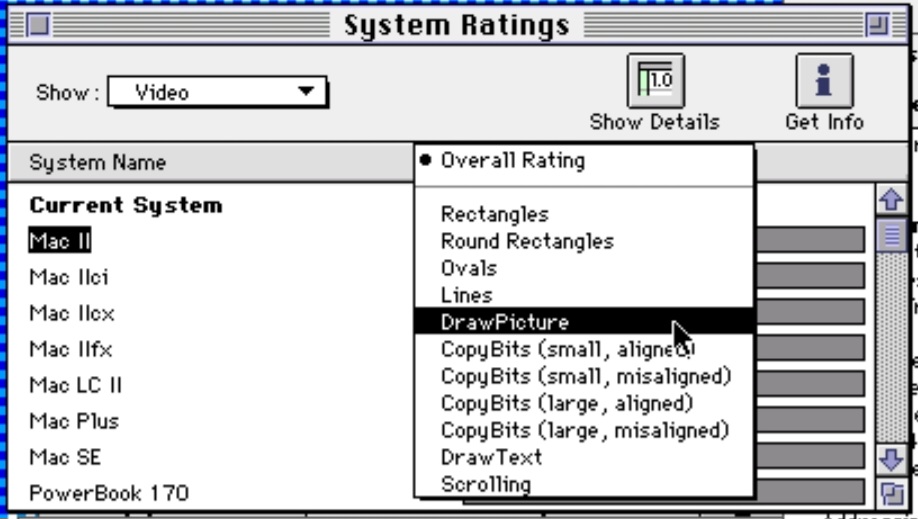
Video Individual Test Results Menu 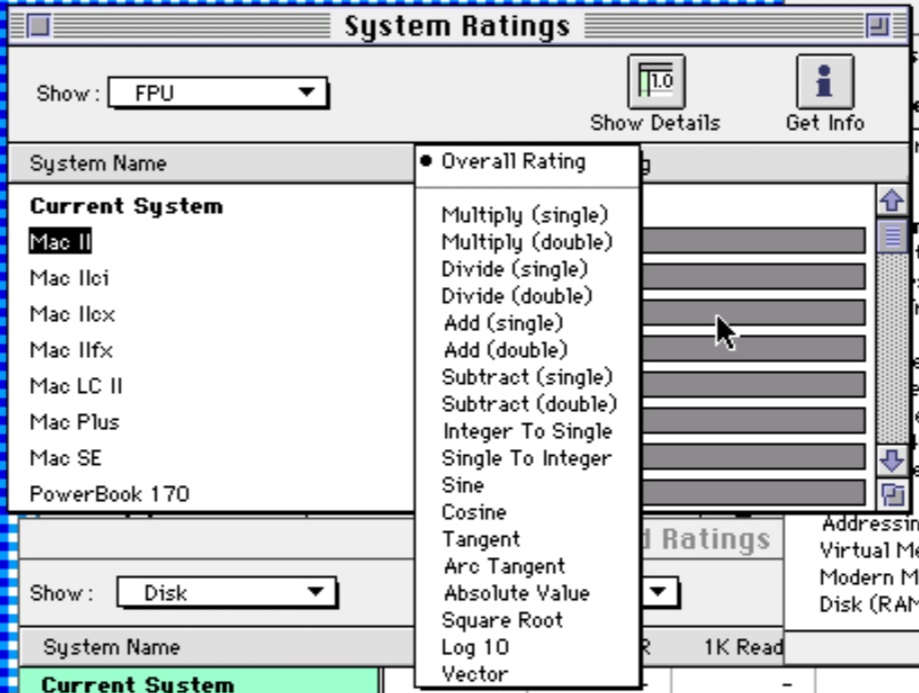
FPU Individual Test Results Menu 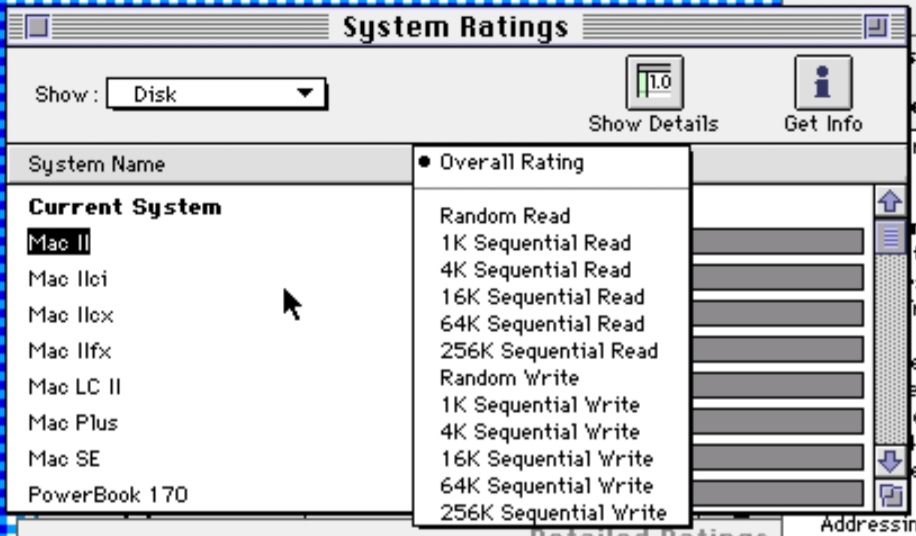
Disk Individual Test Results Menu 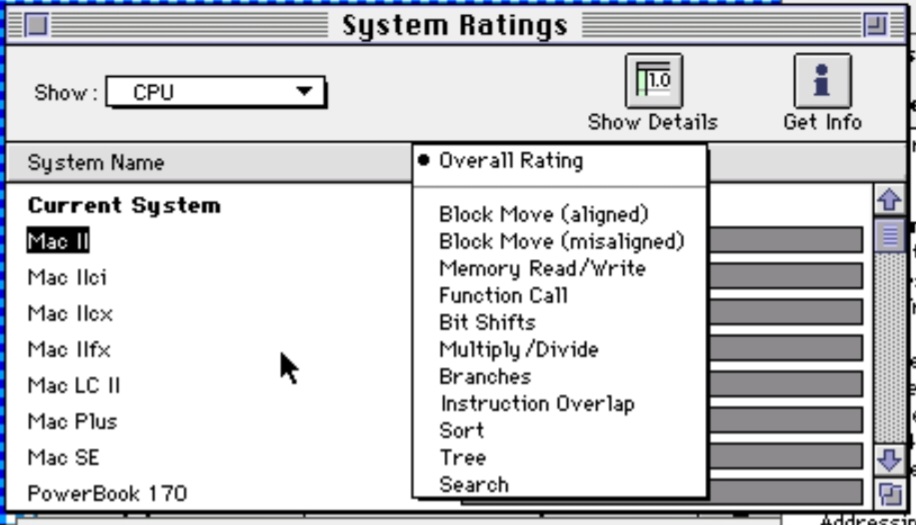
CPU Individual Test Results Menu
To assist in comparing results on a test by test basis, clicking the “Show Details” button presents tabulated results. Within this window, a drop down menu enables you to select between “Absolute” and “Relative” results. I find that generally, “Relative” is more usable with the exception of disk scores, as the “Absolute” scores for the disk results are given in KB/s, which is meaningful.
Getting Norton System Info
Norton System Info was provided as part of the Norton Utilities for Macintosh suite of software. The best way to get a copy of this is by buying a genuine copy on eBay, although I’m quite sure there are copies on Macintosh Garden.
Feedback on this Post
If you have any additional information which you wish to suggest is added to this page, or would like to correct any errors / inaccuracies, please use my contact form to let me know.